An example note that runs a little Python to draw a chart. Copy this file when you want a page with a figure.
Published
January 2, 2026
This note is like the first example, but it also runs a small piece of Python to draw a chart. Copy this file when you want a page with a figure in it.
For the chart to appear, the private Python space must be installed. The setup-windows.ps1 script does that for you the first time.
A Simple Chart
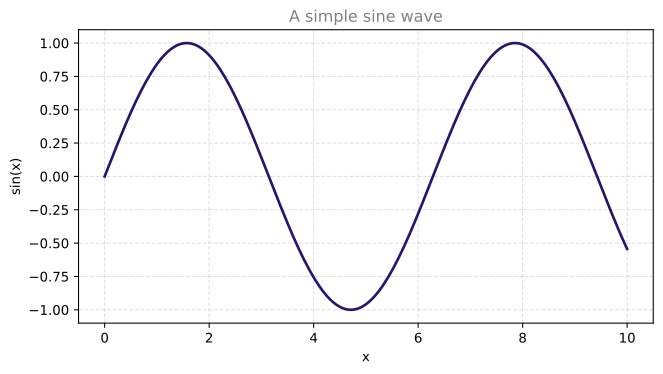
The code below draws a sine wave. Change the numbers and the words, then render the site to see it update.
%config InlineBackend.figure_formats = ['svg']import numpy as npimport matplotlib.pyplot as pltx = np.linspace(0, 10, 200)y = np.sin(x)fig, ax = plt.subplots(figsize=(7, 4))ax.plot(x, y, color="#22176F", linewidth=2)ax.set_title("A simple sine wave", color="gray")ax.set_xlabel("x")ax.set_ylabel("sin(x)")ax.grid(linestyle="--", alpha=0.4)plt.tight_layout()plt.show()
The line that begins with #| is a setting for the code block. Here #| echo: true means the reader can see the Python code above the chart. If you would rather show only the chart and hide the code, change it to #| echo: false.